
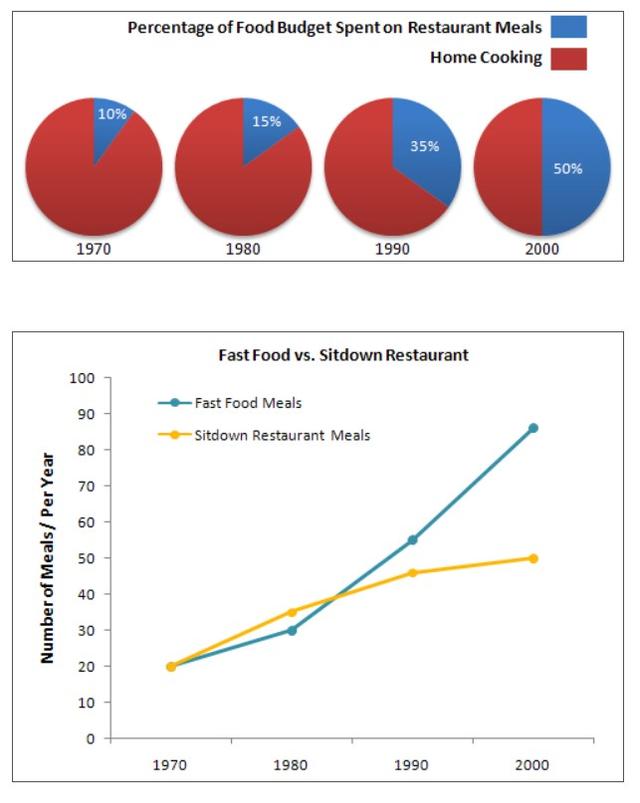
The pie charts illustrated
Use synonyms
food
Correct article usage
the food
budget
ratio between dining out and home cooking the typical families spent in four different years from 1970 to 2000 with ten years gap. The ratio had grown progressively in Use synonyms
favor
of dining out in that period of time.
The family had spent five times more on Change the spelling
favour
restaurant
Use synonyms
meals
in 2000 than they did in 1970. In 2000, half of the Use synonyms
budget
had been spent on Use synonyms
restaurant
Use synonyms
meals
Use synonyms
while
only 10% Linking Words
were
spent on Correct subject-verb agreement
was
it
in 1970. Correct pronoun usage
them
While
the eating out Linking Words
budget
portion increased by 5% and 15% compared Use synonyms
from
the previous decade in 1980 and 2000, respectively, the significant increasement happened in 1990. The Change preposition
to
budget
had raised by 20% from the previous decade.
Use synonyms
While
the pie chart depicted the Linking Words
food
Use synonyms
budget
comparison between dining out and eating at home, the line graph represented the Use synonyms
number
of Use synonyms
meals
per Use synonyms
year
of Use synonyms
dinning
out between the same period of time and the same 10 years gap. It specifically compared Correct your spelling
dining
between
the Change preposition
apply
number
of fast Use synonyms
food
Use synonyms
meals
eaten per Use synonyms
year
and the Use synonyms
number
of sit-down Use synonyms
restaurant
Use synonyms
meals
eaten per Use synonyms
year
, as indicated by Use synonyms
solid
line and segmented line, respectively. In 1970, the Add an article
a solid
the solid
number
was the same between Use synonyms
of
fast Change preposition
apply
food
and of Use synonyms
sit-down
Add an article
a sit-down
Use synonyms
restaurant
, which was 40 Fix the agreement mistake
restaurants
meals
eaten per Use synonyms
year
. Both numbers increased steadily but the Use synonyms
number
of fast Use synonyms
food
meal per Use synonyms
year
were always bigger from 1970 until the middle of 1980Use synonyms
,
when both numbers became equal again. From that Remove the comma
apply
year
onward until 2000, the Use synonyms
number
of sit-down Use synonyms
restaurant
Use synonyms
meals
had increased significantly and had never been surpassed by the Use synonyms
number
of fast Use synonyms
food
Use synonyms
meals
which had been increasing Use synonyms
also
but not that fast.Linking Words