
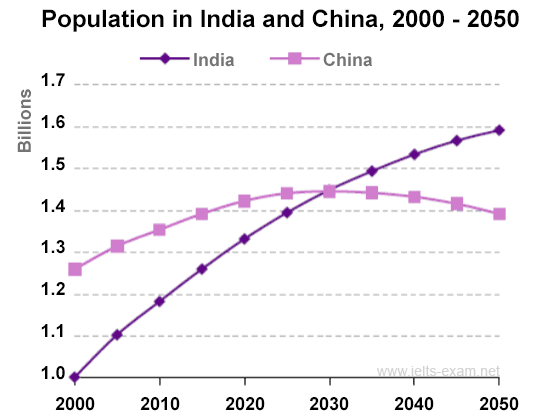
The
linegraph
Correct your spelling
line graph
line graphs
illustrate
the past, current and projected Correct subject-verb agreement
illustrates
population
of the two Use synonyms
countries
which are Use synonyms
China
and Use synonyms
India
between 1990 and 2050. Use synonyms
Overall
, it can be clearly seen that there is Linking Words
and
upward trend for Correct your spelling
an
both
Use synonyms
countries
. The dotted line Use synonyms
demonstrate
the trend of Change the verb form
demonstrates
China
Use synonyms
while
the solid line Linking Words
demonstrate
the Change the verb form
demonstrates
population
of Use synonyms
India
. In 1990, the Use synonyms
population
of Use synonyms
India
were about 0.85 Use synonyms
Use synonyms
billions
Fix the agreement mistake
billion
of
people Change preposition
apply
whereas
there was a huge Linking Words
diffrent
from Correct your spelling
difference
different
China
with more than 1.1 Use synonyms
Use synonyms
billions
Fix the agreement mistake
billion
of
people. In the next years, the Change preposition
apply
population
of Use synonyms
both
Use synonyms
China
and Use synonyms
India
increased Use synonyms
steady
. In 2020, the inhabitants of Change the adjective
steadily
both
Use synonyms
the
Correct article usage
apply
countries
Use synonyms
has
a small difference, Wrong verb form
had
China
Use synonyms
were
1.4 Verb problem
had
Use synonyms
billions
and Change to singular
billion
India
Use synonyms
were
1.3 Verb problem
had
Use synonyms
billions
of people. The two lines describe the Fix the agreement mistake
billion
population
of Use synonyms
both
the Use synonyms
countries
intersect each other in 20330 which Use synonyms
remained
that the Verb problem
means
population
will be the same Use synonyms
this
year. It is projected that Linking Words
Use synonyms
China
Change noun form
China's
population
will start declining after 2030 Use synonyms
while
Linking Words
India
will continue to increase and will reachUse synonyms
to
1.6 million in 2050.Change preposition
apply