You should spend about 20 minutes on this task. The line graph shows the number of books that were borrowed in four different months in 2014 from four village libraries, and the pie chart shows the percentage of books, by type, that were borrowed over this time. Summarise the information by selecting and reporting the main features and make comparisons where relevant. Write at least 150 words.

You should spend about 20 minutes on this task.

The line graph shows the number of books that were borrowed in four different months in 2014 from four village libraries, and the pie chart shows the percentage of books, by type, that were borrowed over this time.

Summarise the information by selecting and reporting the main features and make comparisons where relevant.

Write at least 150 words.
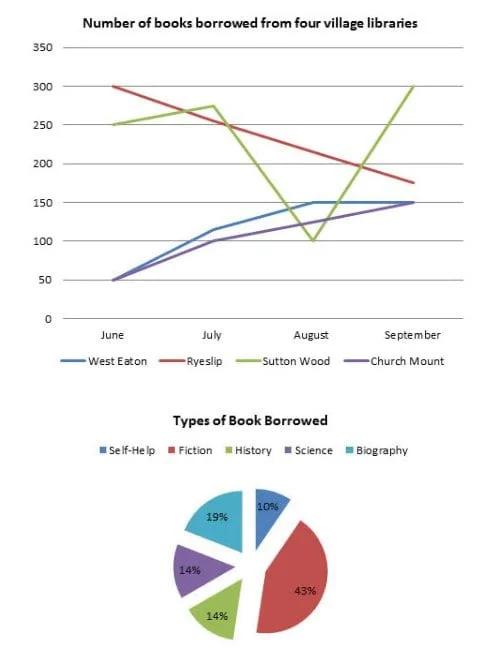
The graph provides information on the books that were taken as
loan
Fix the agreement mistake
loans
show examples
in the months of (June, July, August and September) from four different village book collections in the year 2014 and
pie
Correct article usage
the pie
show examples
chart illustrates the
books
Change the noun form
book
show examples
varieties that were taken as
loan
Fix the agreement mistake
loans
show examples
over the period percentage-wise.
Overall
,
Submitted by shahisandesh95 on

Unauthorized use and/or duplication of this material without express and written permission from this site’s author and/or owner is strictly prohibited. Excerpts and links may be used, provided that full and clear credit is given to Writing9 with appropriate and specific direction to the original content.

Linking words: Add more linking words.
Basic structure: Write more paragraphs.
Basic structure: Add more body paragraphs.
Common mistake: Your writing should be 150-250 words.
Basic structure: Write more paragraphs.
Vocabulary: Only 5 basic words for charts were used.
Vocabulary: Use several vocabularies to present the data in the second paragraph.
What to do next:
Look at other essays: