
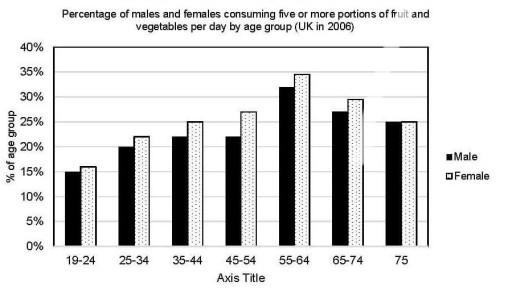
The bar graph illustrates, the proportions of male and female intake of a fifth or greater part of fruits and
vegetables
per day by a different age category in The United Kingdom in 2006, as recommended by the World Health Organization.
Use synonyms
Overall
, the given bar graph shows the 55-64 old Linking Words
males
and girls consumed more fruits and Use synonyms
vegetables
as compared to the lowest consumed by the youngest on a daily basis.
It is conspicuous that, in the age group of 55 to 64 women consumed about 35% compared to Use synonyms
males
32%. Which was highest among all age groups. Use synonyms
Firstly
, 65-75 years old were the second highest females nearly 30%, Linking Words
whereas
27% of Linking Words
males
consumed natural food. Use synonyms
Secondly
, 45-54 females were again dominating over Linking Words
males
, which was 27% to 22% boys respectively.
Probing ahead, seniors of 75 years male and females remained constant at 25%. Use synonyms
Furthermore
, 35-44 old girls were 25%, Linking Words
whereas
Linking Words
males
were nearly 22% ate fruits and Use synonyms
vegetables
. Use synonyms
Moreover
, 25-34% of humans were consumed, mother 22% and 20% of Linking Words
males
respectively. Use synonyms
Lastly
, the lowest consumers of fruit and Linking Words
vegetables
were 19-24 years old, guys were standing at 15% Use synonyms
while
mothers were slightly at 17%.Linking Words